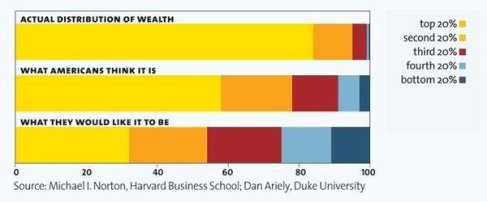
This data has been around for a while and was recently presented in graphical form on the Rachel Maddow show:
"In last night's introduction to Rachel's interview with Chris Hayes about his new book, she showed a graph depicting the wealth distribution people prefer, the distribution they think exists and the actual distribution of wealth in America. Folks on the Twitter clamored for the link, and our intern Sally tells me there are a lot of requests for it in the Rachel@msnbc.com mailbox as well, so here it is."
http://maddowblog.msnbc.msn.com/_news/2012/06/21/12345961-that-wealth-inequality-chart-rachel-showed-last-night?lite
The purpose of this blog is to serve as a quick reference to political and economic data presented primarily in graphical format, with tables and other charts where appropriate. Use the search box to quickly locate the data you are seeking. Go Dems!
Saturday, June 23, 2012
Tuesday, June 12, 2012
More Firemen, More Policemen, More Teachers
From Paul Krugman's blog:
http://krugman.blogs.nytimes.com/2012/06/12/more-firemen-more-policemen-more-teachers/?nl=opinion&emc=edit_ty_20120612
First, Mitt Romney ridiculed Obama for saying that we need more public employment:
He says we need more firemen, more policemen, more teachers. Did he not get the message in Wisconsin?
Afterwards, some commentators wondered, couldn’t he have chosen different professions to ridicule?
And the answer is no. When we talk about public workers, that’s pretty much who we’re talking about:
Monday, June 11, 2012
As unions decline, inequality rises
http://www.epi.org/publication/unions-decline-inequality-rises/
"To a remarkable extent, inequality, which fell during the New Deal but has risen dramatically since the late 1970s, corresponds to the rise and fall of unionization in the United States."
Sunday, June 3, 2012
How the "Job Creators" REALLY Spend Their Money
"Marketwatch estimates that over 90% of the assets owned by millionaires are held in a combination of low-risk investments (bonds and cash), the stock market, and real estate. According to economist Richard Wolff, about half of the assets of the richest 1% are held in unincorporated business equity (personal business accounts). The Wall Street Journal notes that over three-quarters of individuals worth over $20 million are invested in hedge funds."
http://www.commondreams.org/view/2012/05/29-1
Unfortunately for Eric Ferhnstrom, a senior campaign advisor to the Romney campaign, Paul Krugman (who's been on a tear lately) was on "This Week" Sunday morning to dismantle all of his vapid talking points.
Great link from Crooks and Liars web site:
http://crooksandliars.com/blue-texan/week-paul-krugman-destroys-romney-surro
"Unfortunately for Eric Ferhnstrom, a senior campaign advisor to the Romney campaign, Paul Krugman (who's been on a tear lately) was on "This Week" Sunday morning to dismantle all of his vapid talking points."
http://crooksandliars.com/blue-texan/week-paul-krugman-destroys-romney-surro
"Unfortunately for Eric Ferhnstrom, a senior campaign advisor to the Romney campaign, Paul Krugman (who's been on a tear lately) was on "This Week" Sunday morning to dismantle all of his vapid talking points."
Bush on Jobs -- The Worst Track Record on Record
An oldie but goodie that will become more relevant as we get closer to the election. Romney's economic plan is just a rehash of old ideas and this chart gives us the results of that approach. Take note of the column labeled 'jobs created per year in office.'
http://blogs.wsj.com/economics/2009/01/09/bush-on-jobs-the-worst-track-record-on-record/
Saturday, June 2, 2012
Comparison of European and US Gas Prices
Interesting graph from the environmental site Grist. And no, Romney-ites, the President has little influence over the price of oil!
http://grist.org/energy-policy/the-only-solution-to-high-gas-prices-with-charts/
Subscribe to:
Posts (Atom)